Fixed & Dynamic Benchmarking
Benchmarking Antimicrobial Use
& Antimicrobials in the Environment
Page 06 /
What Does Benchmarking Look Like?
As highlighted above, some countries, such as the Netherlands and Denmark, have a national benchmarking program in place; however, in Canada, this type of program does not exist. However, groups of veterinary clinics or producers, typically within the same industry or the same region, could create their own benchmarking for antimicrobial use to help participants identify those who are highly successful at minimizing AMU, and those who are struggling with AMU and could use some help.
)
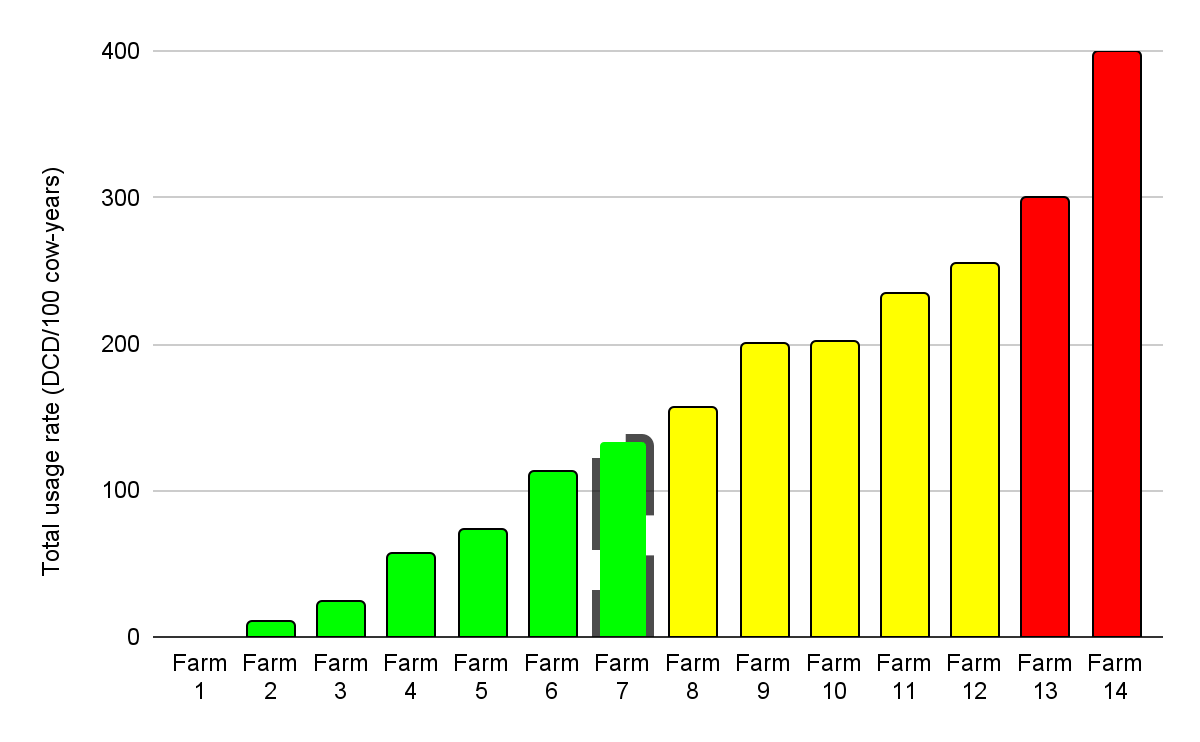
The first step with benchmarking is to set up a system for collecting the data above for each participating farm or veterinary clinic in the group. The more automated the data collection and calculations can be (e.g. using a spreadsheet, app or other program), the easier it is to analyze the data on an ongoing basis. Then the data from multiple farms or clinics can be put together in a table or graph to make comparison easier. Usually the participants are anonymized for the purpose of comparison (e.g. each participant is assigned an unique number or letter) so that no one participant can be identified, but each participant knows their own identifier so they can see how they compare to others.
Thresholds can then be set as the “benchmarks”to help identify farms that may be high users of antimicrobials. There are two types of approaches to setting benchmarks12:
-
1. Fixed Benchmarking
-
2. Dynamic Benchmarking
Although these benchmark reports can encourage behavioral change on their own, especially for motivated producers, additional interventions help maximize their success. These interventions could include:
- One-on-one meetings with a veterinarian to develop an action plan to reduce antimicrobial use
- Applying management changes to reduce disease incidence
- Having additional visits with the veterinarian or other advisors.
Beyond these, a focus farm group could be created, where a group of farmers could meet regularly and work collaboratively to discuss how to reduce antimicrobial use while using their benchmark reports. This has led to positive on-farm management changes and encouraged peer learning to help farmers to adapt and develop responsible antimicrobial use practices for infectious diseases13 and antimicrobial use14.
Take Home Messages
Benchmarking represents an area that could be used to motivate on-farm change surrounding antimicrobial use. The key to benchmarking is first establishing reliable monitoring of antimicrobial use, and then converting these data into a standardized metric, like defined daily doses or defined course doses, to compare antimicrobial use between participants. Combining benchmarking with a follow up intervention can be the best combination to drive change.
References
- Ettorchi, T.A., M. Levif, and P. Michel. 2021. Benchmarking: A method for continuous quality improvement in health. Healthc Policy. 7:101-119.
- Willmington, C., P. Belardi, A.M. Murante, and M. Vainieri. 2022. The contribution of benchmarking to quality improvement in healthcare. A systematic literature review. BMC Health Services Research.
- Koketsu, Y., Y. Sasaki, H. Ichikawa, and M. Kaneko. 2010. Benchmarking in animal agriculture: Concepts and applications.
- Speksnijder, D.C., D.J. Mevius, C.J.M. Bruschke, and J.A. Wagenaar. 2015. Reduction of veterinary antimicrobial use in the Netherlands. The Dutch Success Model. Zoonoses and Public Health. 62:79-87.
- Bos, M.E.H., D.J. MEvius, J.A. Wagenaar, I.M. van Geijlswijk, J.W. Mouton, and D.J.J. Heederik. 2015. Antimicrobial prescription patterns of veterinarians: introduction of a benchmarking approach. J Antimicro Chemotherapy. 70:2423-2425.
- Antunes, A.C.L., and V.F. Jensen. 2020. Close to a decade of decrease in antimicrobial usage in Danish pig production: Evaluating the effect of the yellow card scheme. Frontiers in Veterinary Science.
- Belay, D.G., and J.D. Jensen. 2022. Quantitative input restriction and farmers’ economic performance: Evidence from Denmark’s yellow card initiative on antibiotics. J Agriculture Economics/ 73:155-171.
- Mills, H.L., A. Turner, L. Morgans, J. Massey, H. Schubert, G. Rees, D. Barrett, A. Dowsey, and K.K. Reyher. 2018. Evaluation of metrics for benchmarking antimicrobial use in the UK dairy industry. Vet Record. 182: 379-379.
- Bosman, A.L., D. Loest, C.A. Carson, A. Agunos, L. Collineau, and D.F. Léger. 2019. Developing Canadian defined daily doses for animals: a metric to quantify antimicrobial use. Front Vet Sci. 6:220.
- Lardé, H., S. Dufour, M. Archambault, D. Léger, D. Loest, J-P. Roy, and D. Francoz. 2020. Assignment of Canadian defined daily disease and Canadian defined course doses for quantification of antimicrobial usage in cattle. Front Vet Sci.
- Lardé, H., D. Francoz, J-P. Roy, J. Massé, M. Archamault, M-E. Paradia, and S. Dufour. 2021. Comparison of quantification methods to estimate farm-level usage of antimicrobials other than in medicated feed in dairy farms from Québec, Canada. Microorganisms
- Sanders, P. et al. 2020. Monitoring of farm-level antimicrobial use to guide stewardship: Overview of existing systems and analysis of key components and processes. Frontiers in Veterinary Science
- Roche, S.M., M. Von Massow, D. Renaud, D.A. Shock, A. Jones-Bitton, and D.F. Kelton. 2020. Cost-benefit of implementing a participatory extension model for improving on-farm adoption of Johne’s disease control recommendations. J Dairy Sci. 103:451-472.
- Morgans, L.C., et al. 2021. A participatory, farmer-led approach to changing practices around antimicrobial use on UK farms. J Dairy Sci. 104:2212-2230.